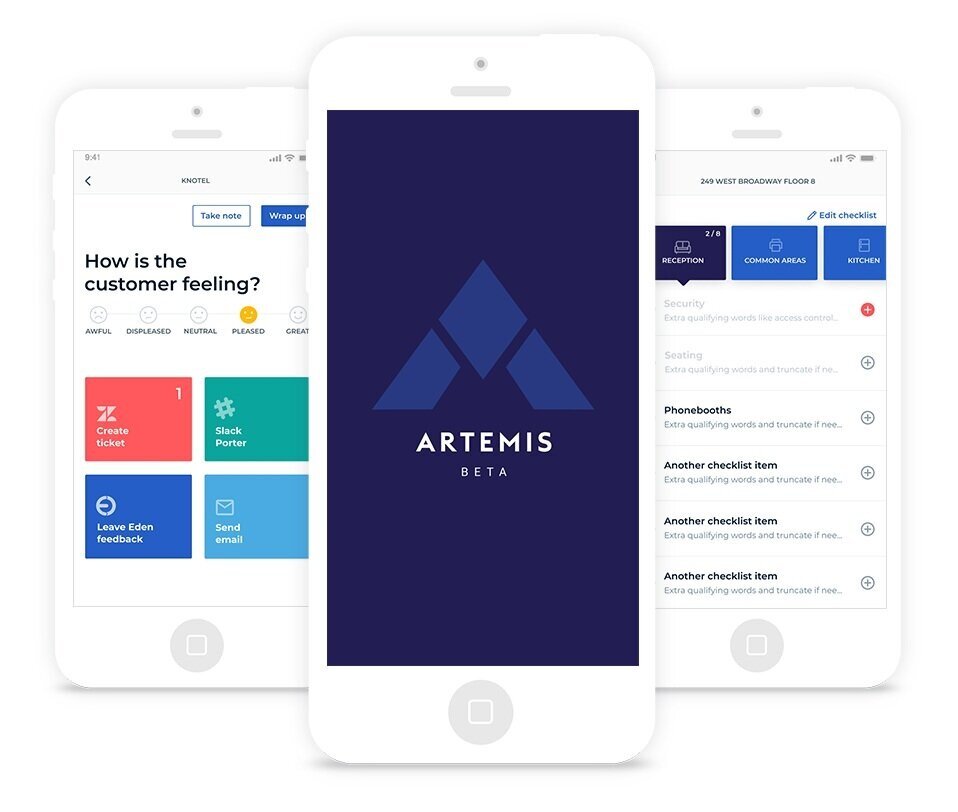
Workflow and data collection tool
This tool empowers managers to proactively record office issues. We strongly believed upholding consistent standards would improve customer satisfaction.
-
Context
Knotel offers flexible leases and office services for businesses around the globe. One of these services involves a Customer Manager handling day-to-day space issues, requests and communication with the client’s office manager.
-
Problem
Partnering with Regional Managers, we found there were no consistent standards in Knotel office spaces. Even if there was, there wasn’t a centralized place to record and view if these standards were being upheld by Knotel Customer Managers.
-
Business goal
To increase customer retention and, in the future, be able to predict whether or not a customer would renew their lease.
-
Product goals
For Knotel to proactively catch office issues before clients do (To increase the tickets filed by Knotel Customer Managers in app vs our customers by 10% within the first 3 months)
To start creating baselines to consistently measure customer satisfaction (For every customer to have at least 1 satisfaction report completed by a Knotel Customer Manager within the first month)
We were approached with a problem...
My team was first approached by Regional Managers wanting to have better visibility into how their customers were doing; this included if the spaces in their region were being consistently and properly audited and if customers were happy with the upkeep. They came to us with their proposed solution - to require each Knotel Customer Manager they managed to complete a bi-monthly space audit for each space they oversaw.
We took a step back and consolidated what we knew and where our blind spots were:
We gathered potential inputs for measuring customer satisfaction:
Early discovery showed a slight correlation in the more issues reported by the customer, the less they were satisfied with Knotel (Graph A); we wanted to continue tracking these data points to understand the significance of this potential correlation.
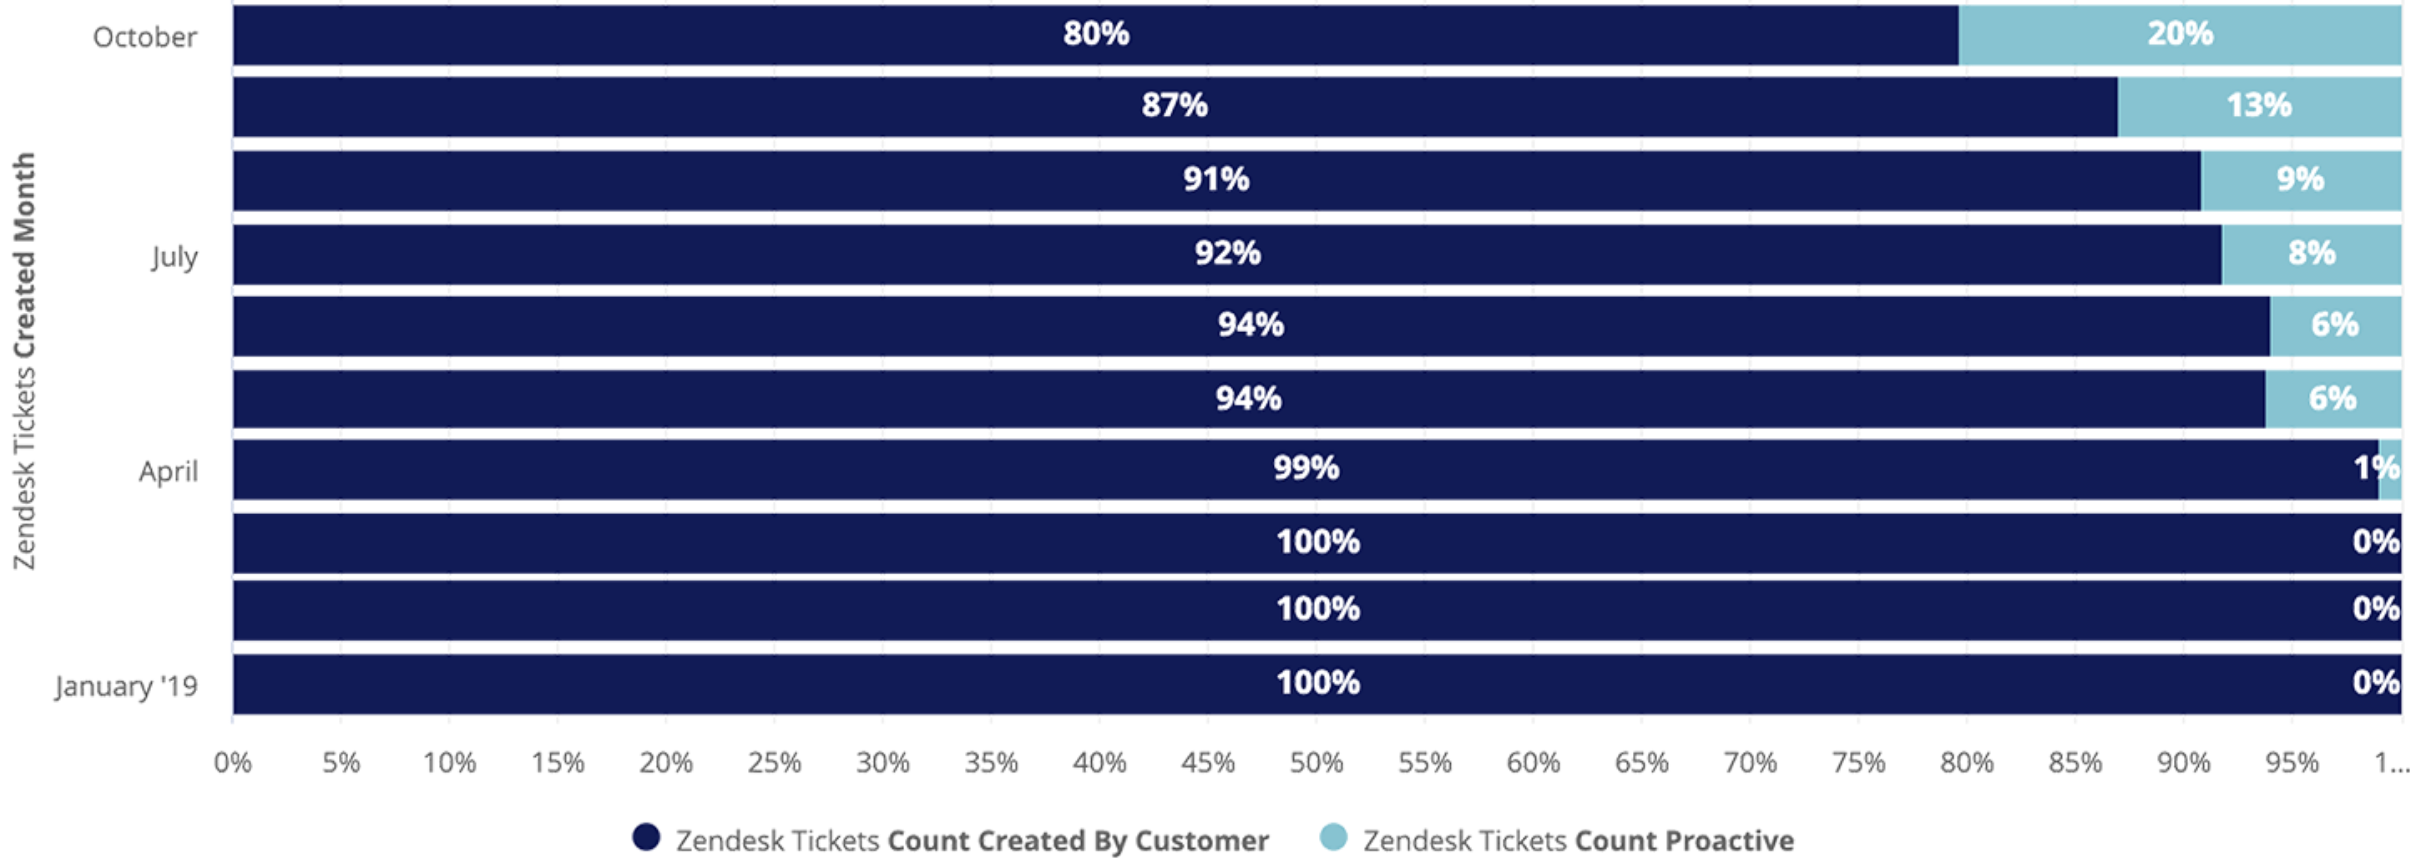
At the time, we noticed most issues were reported by customers and not Knotel Customer Managers. (Graph B)
We scheduled 5 walkthroughs with Knotel Customer Managers to learn about their day-to-day (Customer Behavior Segment created below). A few things we learned about Customer Managers:
They are the face of Knotel and have a lot of information on our customers no one else in the company has
They oftentimes feel undervalued as they bear the weight of a customer’s disappointment even if they’re not the source


We ideated on potential solutions to test…
To gain additional insights, we created 20+ paper sketches of what this product could be based on our initial goals and what we learned on our walkthroughs.
The design researcher and I tackled this phase together. We presented these sketches in 1:1 sessions with 4 Customer Managers.

We gathered takeaways and iterated…
Top takeaways:
1. The idea of being proactive with a checklist is great, but most of the time they’re reacting to situations that require them to quickly move from space to space (“Hey there’s a massive leak in the kitchen. Can you fix this asap?”). In order to give a Customer Manager true value we wanted to replicate this workflow and give them flexibility to record issues quickly if need be.

2. Since every property is so unique (“One of my spaces has 2 kitchens while another of my spaces doesn’t even have one”), Customer Managers must be able to heavily edit the checklist to account for this.

3. There are various actions a Customer Manager can take in reporting issues. In order to find value in this tool, the experience needs to account for these quick actions so they don’t veer away from the app.

4. Showing progression is important since it already feels like a tedious task. This was a nice-to-have as we knew it would be a welcome feature but we weren’t confident the lack of this feature would disrupt adoption.

We completed real-world scenario testing with a prototype...
We tested this first prototype with 8 Customer Managers from both NY and SF markets. We asked each Customer Manager to talk out loud as they navigated a customer’s space and used the prototype to capture relevant data.
With this approach, we validated that the Space QA (proactive walkthrough) and Check-in (reactive day-to-day actions) made sense as separate workflows. Besides a few minor usability issues, there were 2 larger takeaways:
1. The lack of editing capabilities was still causing a lot of friction and we felt it could be a reason a Customer Manager would abandon the app. We tested a few additional editing functionalities. (screens below)
2. Customer Managers expected (and wanted) to add context to a customer disposition rating, mainly for their Regional Managers and out-of-office covers. This was an easy win from a design and engineering standpoint. (screens below)

We launched the beta…
We launched the month-long beta with 8 Customer Managers (some who were already familiar with the app and some who weren’t).
Beta goals were completed:
These Customer Managers also recorded at least one customer satisfaction rating per month, if not a few per month. (Image represents the flow of customer insights and potential opportunities to push for an increase in actionable insights)
The Customer Managers used the proactive Space QA to check each of their spaces every 2 weeks.
All Customer Managers gave the experience a high rating for ease and intuitiveness (4 or 5 out of 5).

Following up with these Customer Managers, we decided there were no blockers; we continued to release the app to Customer Managers in batches and gathered early feedback on our product goals from August to October:
We reduced the ratio of reactive to proactive tickets by 10% (graph below); we wanted to continue gauging this ratio to understand if this trend would continue.
Every Customer Manager launched on the app created at least one customer satisfaction report per month. We were on our way to capturing a baseline of customer data.
Hypothetically, every 3 months (if I would have stayed at the company longer) I would have overlaid the customer satisfaction scores with space issues to see if there was any correlation.
In addition, I would have led a stakeholder brainstorming session to prioritize other interesting data points to track (i.e. time to resolution on space issues) and overlay this data with the customer satisfaction scores to understand if there was any correlation.